Recent Posts

FY2017 Financials – Income & Expenses
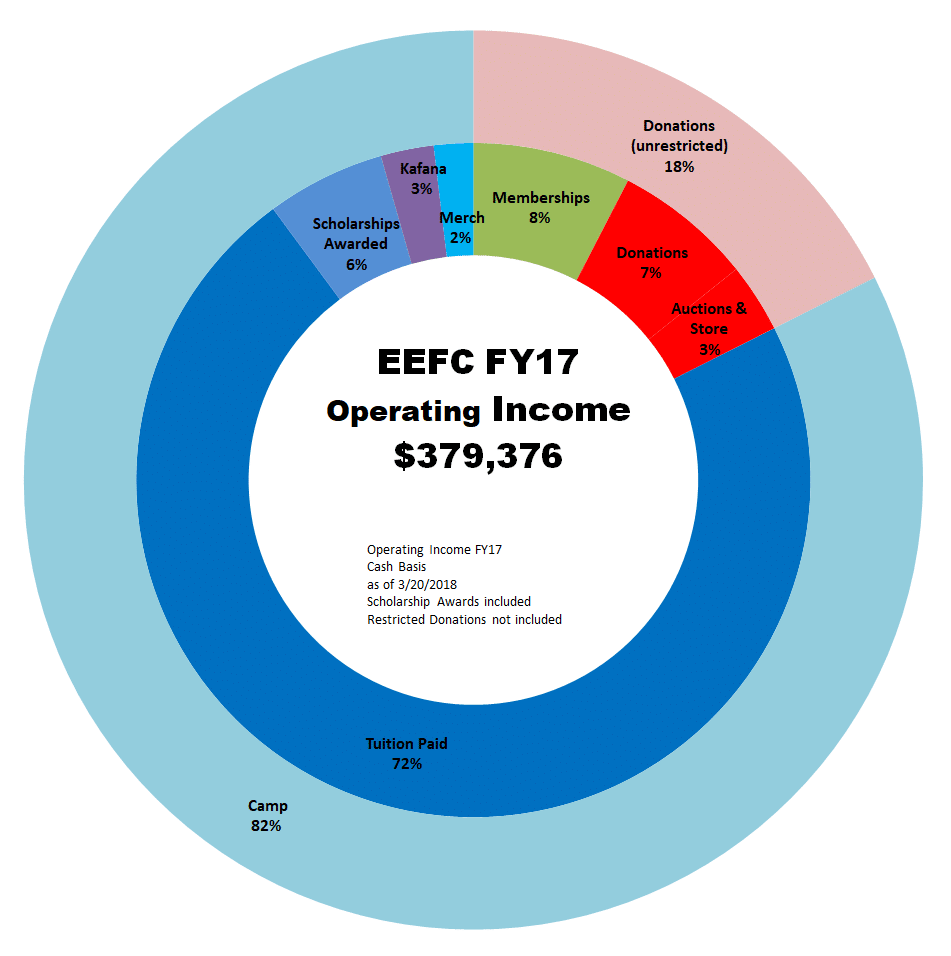
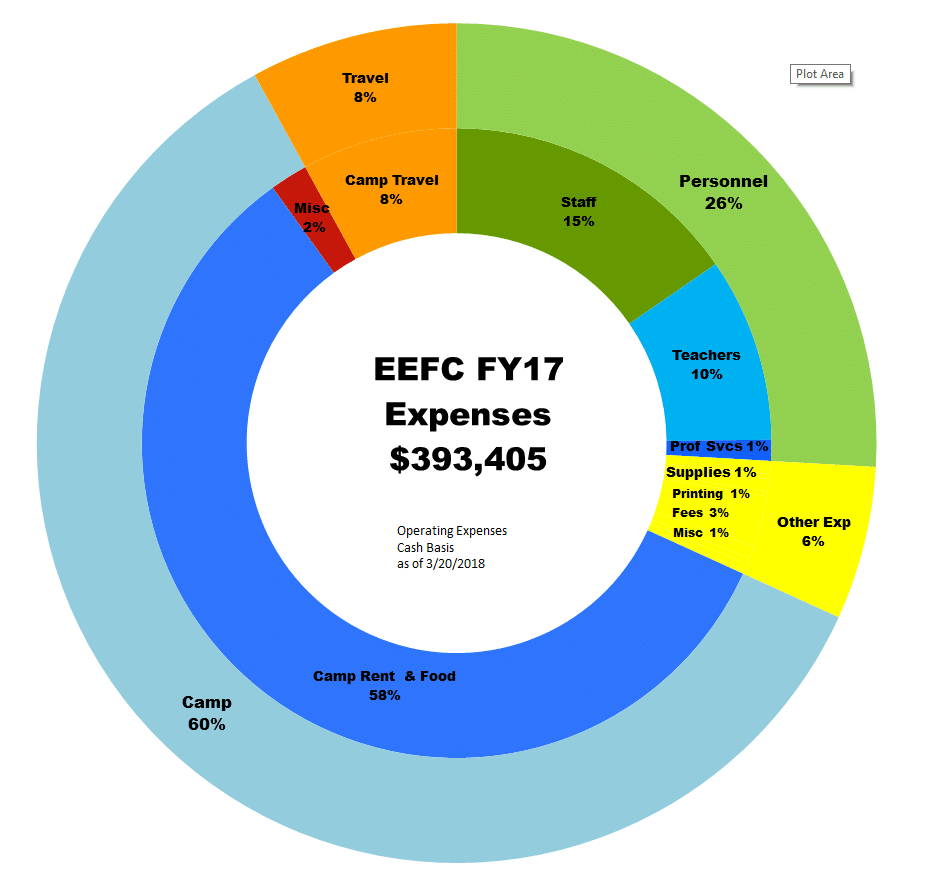
The EEFC fiscal 2017 year ended in September. These charts summarize the EEFC’s FY17 operating income and expenses. Scholarship donations and other restricted income are not included.


Summary:
EEFC had an operating deficit of $14,030 in FY17. We had budgeted for a deficit of $12,000. We ended the fiscal year with assets of roughly $186,212 compared with $176,000 in FY16. We received scholarship and nest egg donations of approx $33,587- restricted income that is not included in the operating budget until it is awarded.
Notes:
Prior year FY2016 charts are here. FY2015 charts are here. FY2014 charts are here. FY2010-2013 charts are here. Inner rings have more detailed categories, outer rings are summary categories. Changes in categories are a result of changes in EEFC’s budgeting and accounting procedures. Questions or suggestions can be emailed to the board liaison at board@eefc.org.
Income chart
- Operating income includes scholarships awarded in FY17. Prior to FY15, scholarship awards were included in the Tuition slice.
Expense chart
- Work Exchange and Tuition Waivers are not expenses, they are included in Camp rent & food

